Summer low flow in streams and rivers
- Ecosystem Recovery Goal
- Functioning Habitat
- Vital Sign
- Streams and Floodplains
- Indicator
- Summer low flow in streams and rivers
- Indicator Type
- Vital Sign Indicator
 Salmon Habitat Indicator
- Measurement Unit
- Percent (%)
- Indicator Trend / Target Status
-
- Target
- No targets are currently set for this indicator.
- Vital Sign Indicator Reporter
- Jim Shedd
jish461@ECY.WA.GOV
Washington State Department of Ecology - Contributing Partners
- Last Updated
- 04/14/2025
The summer low flow indicator measures current conditions and long-term trends in streamflows that occur during summer months when there is less rain and temperatures are warmer. The indicator tells us how often summer flows are below normal, relative to a 50-year baseline, in unregulated streams and rivers across Puget Sound. When flows are below normal, less water is available for people and wildlife to use, less habitat is available for salmon, and it can contribute to increased water temperatures and lower water quality.
When flows in streams and rivers diminish, it places pressure on municipal, residential, industrial, and agricultural water supplies. Keeping track of flows in the summer, the driest and warmest time of year, helps resource managers and communities create strategies that help to minimize or mitigate declining flows where possible and respond to climate change.
Below normal summer flows also adversely affect fish and wildlife habitats. During the period of summer low flows, there are several salmon and other species at various life stages in Puget Sound streams and rivers. Low flows have the potential to impact habitat capacity for rearing juvenile salmon and can prevent access to, and reduce the availability of, adult spawning areas.
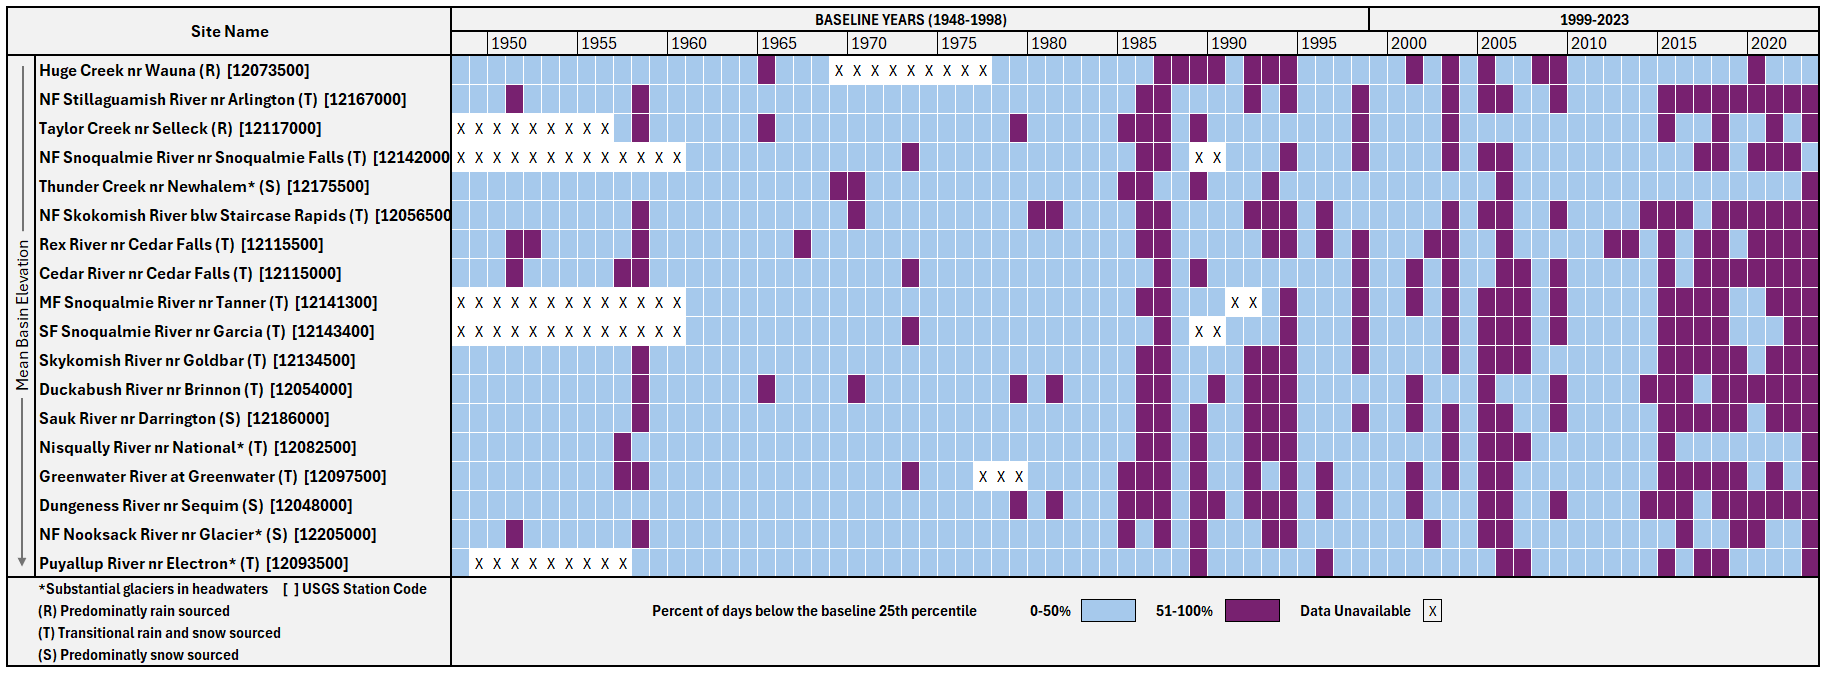
- The occurrence of below normal summer flows is increasing in unregulated streams and rivers across Puget Sound. In 2023, summer flows were below normal most of the time at 16 of the 18 indicator gages (see Interpretation of Results for more details). Thus, we determine this indicator to be GETTING WORSE.
- Consecutive years with below normal summer flows have increased since 1985 and especially since 2015. Since 2015, most of the rain, transitional, and snow-fed watersheds had below normal summer flows over 60% of the time.
- Accelerated glacial melt may temporarily offset diminishing low flows in some rivers. Summer flows are enhanced by glacier meltwater at four of the indicator gages. These systems have generally fewer occurrences of below normal flows during the summer flow period.
- Flows below 1948-1998 baseline minimums were observed at least once at all indicator gages during the 1999-2023 study period. The occurrences of flows below baseline minimums have increased since 2015. In 2023, 7-day mean daily flows below baseline minimums occurred greater than 50 percent of the time at 9 of the 18 gages in the analysis.
- Supporting analysis shows that the timing of streamflow is changing in Puget Sound. Between 1948 and 2023, the center of timing (CT) at most indicator gages regressed to earlier occurrences over time. This means the low flow season in our region is becoming longer as larger fractions of total annual runoff occur progressively earlier in the year (see Interpretation of Results – Changes in Streamflow Timing for more details).
Monitoring Program: Streamflow Monitoring Program, Washington Department of Ecology
Data Source: U.S. Geological Survey Groundwater and Streamflow Information Program - Streamgaging Network, compiled by the Streamflow Monitoring Program at the Washington Department of Ecology
Summer flows in streams and rivers occur at the time of year characterized by warm temperatures, little rainfall, and depleted snowpacks. This coincides with the time when water demands are greatest, despite that supply is lowest. The USGS Groundwater and Streamflow Information Program collects streamflow data through a network of streamgages that continuously monitor streams, which report mean daily flows year-round and are available online. From these streamflow records, 7-day mean daily streamflows were computed and serves as the basis for this analysis.
This indicator reports on the number of days during the summer period (July 15 through October 31) that a stream’s 7-day mean daily flow falls below “normal” relative to the baseline data for that river. Normal flows are defined by conditions observed over a 50-year baseline, from 1948 to 1998.
Importance to Salmon
Juvenile coho, steelhead, and stream-type Chinook spend one or more summers in freshwater, and adult Chinook and sockeye hold in rivers through late summer before spawning. When summer flows drop, riffles go shallow, side channels disconnect from the main stem, and the area of usable rearing habitat shrinks.
Low flows also warm faster and hold less dissolved oxygen. Crowding into the pools that remain raises competition and predation, and shallow riffles can block adult migration to upstream spawning grounds.
SHI Map
SHI Chart
SHI Description
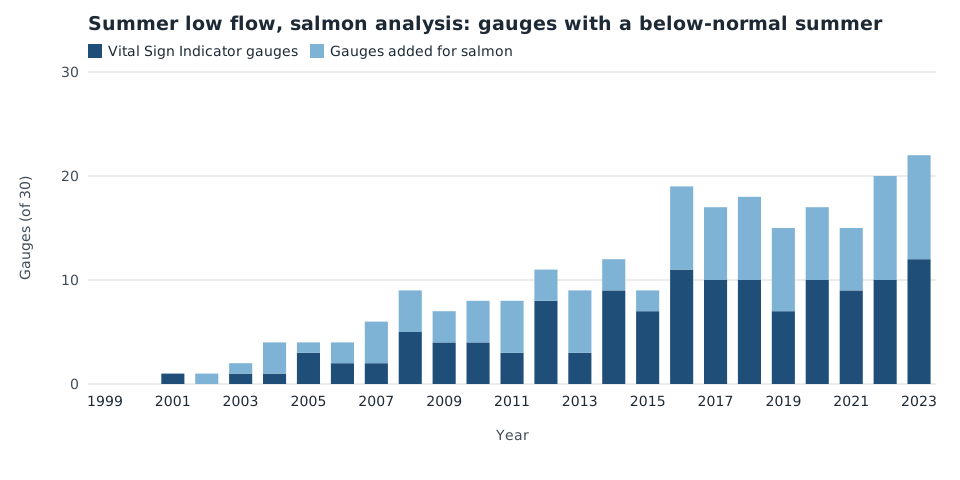
The salmon habitat version of the summer low flow indicator applies the Vital Sign method to 30 streamgages instead of 18. The 12 added gauges sit on lowland, rain-fed streams that carry most of the region's coho and steelhead rearing habitat and are under-represented in the Vital Sign gauge set.
Key SHI Results
- In 2023, summer flows were below normal most of the time at 22 of the 30 gauges in the salmon analysis.
- The 7 added rain-fed gauges show the same direction as the Vital Sign gauges, with longer runs of consecutive below-normal years since 2015.
- Snow-fed gauges in the North Cascades show fewer below-normal summers, consistent with glacier melt temporarily supporting late-season flow.
SHI Methods
Daily discharge records come from the USGS streamgaging network. For each gauge and year, the 7-day mean daily flow is compared with the 25th percentile of the 1948 to 1998 baseline for the same calendar day.
A year counts as below normal at a gauge when 50 percent or more of days between July 15 and October 31 fall below that baseline. Gauges are classed as rain, transitional, or snow sourced from mean basin elevation.
Added gauges were selected for unregulated flow, a record of at least 25 years, and overlap with mapped coho and steelhead rearing reaches.
Interpretation of Results
Agreement between the shared and added gauges suggests the Vital Sign trend is not an artifact of its gauge selection. Lowland rain-fed streams reach below-normal conditions earlier in the season than the higher-elevation Vital Sign gauges.
Because the added gauges have shorter records, their baseline percentiles carry wider uncertainty before 1970.
Additional Information
Summer low flow is reported alongside water temperature in streams and rivers, which shares several of the same gauges.
Datasets
- USGS daily streamflow, Puget Sound unregulated gauges (U.S. Geological Survey)
- Summer low flow baseline percentiles, 1948 to 1998 (Washington State Department of Ecology)
- Coho and steelhead rearing reaches (Washington Department of Fish and Wildlife)
Reporting Guidance
Report the Vital Sign and salmon habitat results together, and state the gauge count for each. Do not combine the two gauge sets into a single trend.