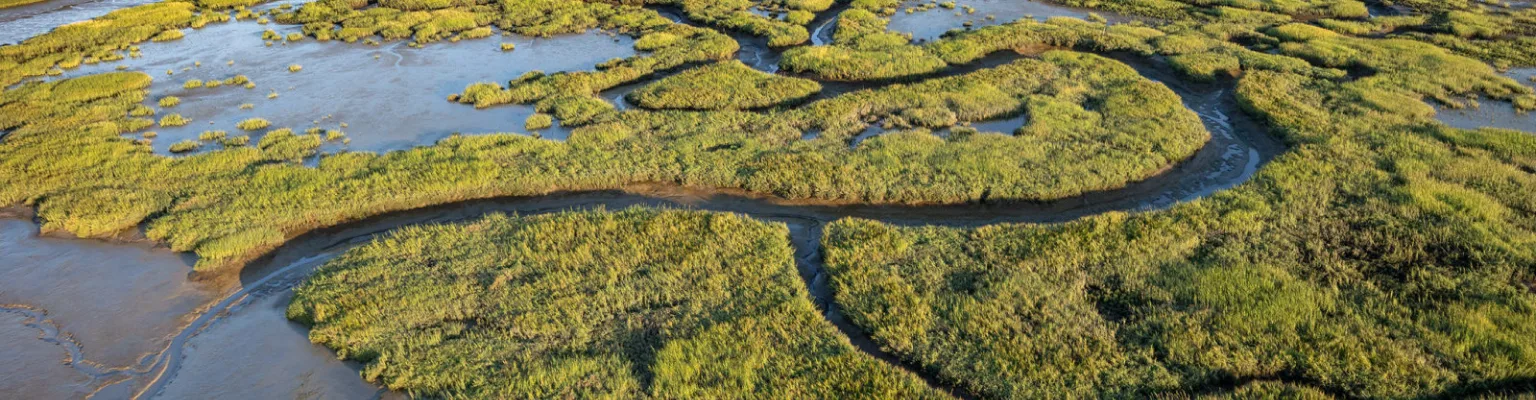
Aerial view of a tidal marsh
Monitoring Results

Metrics

Metrics are how the WRMP measures different indicators of wetland function in the Estuary.

Bar chart: change in Bay-wide tidal wetland extent, 1998–2020
Baylands Geography

Tidal Wetland Extent

Existing, restored, and evolving tidal wetland acreage across the Bay in 1998, 2009, and 2020, tracked against the 100,000-acre regional goal.

Last updated Aug 12, 2025 Download figure: PNG · PDF
Chart: cumulative restored tidal wetland acreage by year of initial restoration
Baylands Geography

Accurate tracking of wetland restoration progress

Cumulative acreage of restored and evolving tidal wetland by year of initial restoration — a new method for tracking progress toward regional restoration goals.

Last updated Aug 12, 2025 Download figure: PNG · PDF
Scatter plot: CRAM index scores of restoration sites against wetland age, with habitat development curve
Wetland ConditionVegetation

Measuring wetland condition with the CRAM Estuarine Habitat Development Curve

CRAM index scores of restoration sites plotted against wetland age show the condition a restoring marsh can be expected to reach over time.

Last updated Aug 12, 2025 Download figure: PNG · PDF
Bar chart: rates of surface elevation change at Petaluma marsh stations against sea-level rise
Wetlands and Sea Level Rise

Surface Elevation Tables – Marker Horizons

Rates of marsh surface elevation change measured at Petaluma stations, compared against the local rate of sea-level rise.

Last updated Aug 12, 2025 Download figure: PNG · PDF